
The following table shows a number of things. After the reference column of population, the next five columns (B-F) deal with changing characteristics of the population: (1) the relation of rural to urban population (B & C); (2) the percentage of the population in the (paid) work force and of the work force in farm labor (D & E); and (3) the percentage of women in the (paid) work force (F). The striking secular trends are: (1) urbanization -- by 1920 over half the population is living in cities of over 2500 persons; (2) industrialization (or other non-agricultural labor) -- by 1880 less than half the work force is in farm labor, by 1960 this had declined to less than 10%, and by 1990 it was less than 2% (in comparison to a place like Tanzania, where, after years of post-colonial socialism, despite some of the highest levels of foreign aid in the world, in the 1990s 85% of the population was still in agriculture); and (3) the increasing participation of women in paid labor, from less than 20% of the work force in 1900 to over 45% by 1990.
The last five columns (G-K) deal with unemployment and poverty. The best comprehensive examination of unemployment is Out of Work, Unemployment and Government in Twentieth-Century America by Richard K. Vedder and Lowell E. Gallaway [Holmes & Meier, 1993]. A secular increase in unemployment is noteworthy: Where unemployment bottomed out at 1.7% in the first decade of the century and at 1.8% in the 20's, it then only got down to 2.9% in the 50's, 3.5% in the 60's, 4.9% in the 70's, and 5.3% in the 80's. In the 90's, unemployment was still only down to 5.6% by 1995. The 1.4% unemployment in the Teens during World War I, the 1.2% in the 40's during World War II, and of course the low of merely 14.3% during the Great Depression in 30's may all be regarded as anomalous for different reasons.
Vedder and Gallaway's simple thesis, well substantiated, is that unemployment is simply to be correlated with the level of wages. "Full employment," to the extent that this means anything, and historically it seems to mean unemployment at less than 2%, is achieved by allowing wages to fall to market clearing levels. (The freer economies in Asia, like that of Hong Kong, where unemployment was 1.9% in 1994, reflect this.) Why this produces the unprecedented prosperity of the turn of the century, the 20's, and the 50's, rather than some Marxist impoverishment of the masses, is explained by Say's Law. The observed secular increase in unemployment, as well as the anomaly of unemployment in the Depression, is mostly due to the political manipulation of wages and labor costs, either seeking to deliberately drive up wages (through the minimum wage, special powers for labor unions, or "prevailing wage" rules for government contracts) or by imposing costs that do not appear in wages (social security taxes, workmen's compensation costs, health insurance, OSHA requirements, ADA requirements, "family leave" costs, etc.). Since it continues to be the political strategy in the United States and elsewhere to increase the compensation of labor through legally mandated wages and benefits, the secular increase in unemployment can be expected to continue, as it has in Western European countries, where the European Economic Union as of 1994, with far more socialized economies than in the United States, still averaged unemployment above 11%.
Although the U.S. economy was very slow coming out of the 1990 recession, and the election of both a Democratic Congress and President in 1992 threatened the renewal of irresponsible taxing, spending, and regulation, the damage done was relatively mild, and the election of a Republican Congress in 1994 helped forestall some of the most grandiose threats. The failure of many promised Republican reforms does not bode well for the future, but meanwhile the comparative advantage of the U.S. economy has told against the European community.
In 1997 France still suffered from double digit unemployment, with low to negative real growth, while in the Spring of 1997, U.S. unemployment actually dipped below 5% for the first time in more than 25 years. A conservative government in France failed in its efforts to reform the mediaeval labor situation, with the stranglehold of the unions on the economy, and the voters curiously responded to this in 1997 by returning to power the socialists, who can only be counted on to make things worse (promising a shorter work week, public service jobs, etc.). Indeed, early in 1998, the French government had accomplished basically nothing, and the long-term unemployed began to demonstrate for their promised free lunch -- as they have begun to do in Germany, with similar levels of unemployment, as well. Following the example of the French, the British and, now (1998), the Germans have returned the socialists to power, with the expectation, apparently, that more socialism will improve their economies.
The prospect for continued stagnation in Europe compares favorably in the United States, even though the growth of burdens on American business has only slowed, not stopped, and the so-called "balanced budget" deal for 1998 negotiated between the Republican Congress and President Clinton was a fraud that merely postponed the day of reckoning behind a smokescreen of optimistic projections and postponed promises, as usual, for real spending reductions. Prosperity, sadly, defers the need for reform, while recessions bring out much of the same kinds of New Deal, anti-capitalist rhetoric and bogus nostrums.
Meanwhile, the State of California could crow that its unemployment rate in January 1998 dropped below 6% for the first time since 1990: to 5.9%. This was progress, but really nothing to brag about. In November 1998, the State was celebrating a reduction in unemployment again, from 6% in September 1998 to 5.9% in October. Can anyone say, "Deja vu"? But the People of California voted the Democrats back into control of the State in the 1998 off-year elections. The economic situation was really far too precarious for people to be voting for Democrats -- indeed, unemployment in Los Angeles County went up to 6.7% from 6.6% in the same period. When October 1998 unemployment was 2.9% in notoriously Right Wing Orange County, it is clear what a difference a business climate can make. Since the State has been driving up the minimum wage ahead of federal levels -- Proposition 210 in 1996 voted in large increases, hitting $5.75 an hour on March 1, 1998; and the new Governor for 1999, Democrat Gray Davis, promised big new increases -- the creation, or even retention, of entry-level and low-level employment will continue to be seriously hampered [note]. Thus, while black teenage unemployment was lower than white teenage unemployment in 1960, it continues now at astronomical levels, 30% or higher. This is a disaster that politicians, even so-called Republicans, lack either the knowledge, the courage, or the honesty to explain to the public.
The last columns display poverty and poverty program data. The locus classicus for the study of the poverty programs of the Great Society is still Losing Ground, American Social Policy 1950-1980 [Basic Books, 1984] by Charles Murray [shown] A guide to the amount of money spent on the War on Poverty is provided in column K, which shows the number of first time enrollments in Department of Labor work and training programs. Those numbers are negligible at first (1963-1966) but increase steadily, hitting a million in 1969, two million in 1972, three million by 1976, and then four million by 1979. This statistic is representative and shows the emptiness of the claim occasionally made that the War on Poverty was not "fully funded" during the Republican Nixon and Ford years. Instead, it may be said that the War on Poverty didn't really get going until the Nixon and Ford years, when, after all, Congresses were consistently in the hands of the Democrats. Then there were the Carter years at the end of the 70's, with Democrats in control both of Congress and the Presidency, and the President personally recommended by Martin Luther King Sr. as a gift from God.
What attends the striking increase in anti-poverty activity is the actual slowing and halting of the fall in the poverty rate. The percentage of the population below the poverty line bottoms out in 1973 at 11.1% and then stagnates or increases from then on. By 1981, only the first year of the Reagan Presidency, the poverty rate is already back up to 14%, where it hadn't been since 1967. At the same time, the percentage of families on AFDC had skyrocketed, from the disturbing 2% of 1963 to what must be the even more disturbing, or shocking, 6.5% of 1980. Programs intended to reduce "dependency" had instead more than tripled it. After the recession of 1982-83, the poverty rate fell slowly to 12.8% in 1989, but now has been back up to 15% in 1993, after the recession of 1992. It is also noteworthy that the general availability of abortion, often presented as necessary for the alleviation of poverty, in fact coincided, after the Roe v. Wade decision, with the period when poverty ceased to decline and began to increase again.
The reasonable conclusion from these events is that the attempt to engineer the end of poverty with Federal poverty programs was in fact misconceived, unnecessary, and tragically counterproductive. The engine that had previously reduced poverty, and which in fact had drawn (and draws) people from all over the world to America, was in part turned off, at least for the target population which it was especially intended to help. The same engine continues to work for others, as people from India, Korea, Armenia, Egypt, etc. achieve financial success the old-fashioned way: starting businesses and working 16 hour days. On the other hand, it has proven extremely difficult to turn off the anti-poverty industry once it got entrenched in politics and bureaucracy. Cutting back on AFDC can easily be attacked as "starving children," even when the children then grow up in environments where honest paid work mostly doesn't even exist and where they are more likely to die by gunfire than by old age.
The poverty warrior interest group created by the War on Poverty continues to advocate precisely the same solutions, like job training, non-judgmental welfare payments, and more and more money, that may decisively be seen to have failed in the 70's. One wonders if a lot of this is not disingenuous. The May 1, 2000 Forbes magazine reports, "One [Chicago] alderman told law student Daniel Liljenquist that he didn't want his constituents going into business for themselves because it might lead them to believe they could become self-sufficient" [p. 88, "Strange Bedfellows"]. This is the frank peonage of the welfare state in a nutshell.
The "welfare reform" reluctantly signed by President Clinton in 1996 recognizes the limits of what can be done by the Federal Government, but the myth is still perpetuated that something can and must be done by Government at some level to end poverty. Instead, what can and must be done is for Government to get out of the poverty business and for people to realize that poverty can be reduced only by the enterprise and industry of private individuals, both those who work hard for pay and those who invest capital in new business. That was a self-evident truth for most of American history, but it has now become corrupted into the idea of "welfare rights," that certain people have the right to be supported in the manner to which they have become accustomed by taxes on the labor and capital of others. That is a formula for parasitism and political rent-seeking, not for the end of poverty.
The persistence of false remedies in the face of the evidence may be seen in a Los Angeles Times article of October 6, 1997, "Promise of Reducing Poverty May Be Found Inside Marriage Vows," by Ronald Brownstein. First it is noted that the Census Bureau had just reported that the poverty rate for the country was still 13.7% -- higher than it was in 1990. This is then contrasted, however, with the statistic that only 5.6% of married families are below the poverty level. Furthermore, of married families where "at least one partner works full time, year-round, no matter how menial the job," the poverty rate is only 1.8%. On the other hand, "nearly one-third" of families headed by single women, and almost 14% of families headed by single men, are below the poverty level.
The obvious conclusion is that poverty persists in the country because the number of stable marriages has declined dramatically over the years, especially in the black community -- where the economic advances of the black middle class are about equally balanced by the decline of the underclass. The "decline," most precisely, turns out to be the decline of marriage. The solutions contemplated by the Time's "National Perspective" reporter, however, are from the traditional arsenal of leftist economics and social engineering: "increase the minimum wage, expand the earned-income tax credit and provide health care for more uninsured children." Driving up unemployment (the effect of the minimum wage) and subsidizing poverty still strikes journalists as sensible policy, even when that kind of thing produced the problem in the first place. The old-fashioned response, on the other hand, which was obvious to anyone a century ago, is simple enough: Get married. That is the remedy suggested by the title of the article, but then it is passed over when "solutions" are expected to involve some kind of government intervention.
These statistics are taken from various sources, including Vedder, Gallaway, and Murray themselves. Some recent employment and poverty figures were found at the Census Bureau and the Bureau of Labor Statistics sites on the Internet. Double poverty figures for years like 1966 and 1974 occur because the way in which the figures were determined changed.
As the years have gone by, I have added a few new numbers to these statistics as they have appeared in the newspapers. I had stopped doing this by 1998 because the purpose of the statistics is to illustrate some historical truths, not to keep track of events in perpetuity. Some comment now may be in order, however. The most recent poverty statistic I have noticed is that the poverty rate, at long last, had gotten back down to 11%. Meanwhile, however, the "dot.com" bubble burst, the stock market fell and, as Bill Clinton was leaving office, signs of a recession began to appear. National unemployment has edged up over 5% again and it is expected that today (11/23/01) the second quarter of negative economic growth will be announced -- the formal definition of a recession. The terrorist destruction of the World Trade Center on 9/11 resulted in a dead loss of billions of dollars, not to mention the talents of the thousands of people, most of them important participants in the finance industry. All of this is a considerable challenge to the economy. That the Bush administration is still talking about tax cuts (while, of course, the Democrats talk about raising taxes), despite the military campaign in Afghanistan, is a good sign. Much of the Bush "economic stimulus" legislation, however, is the same old New Deal type spending. The best that can be hoped is that it is designed to be, at least, harmless political window dressing ("We're doing something").
One of the numbers here was coincidentally confirmed in a surprising place. Hitler's Italian Allies [MacGregor Knox, Cambridge University Press, 2000, p.30],
In The Economist Pocket World in Figures for 2007, we have statistics on automobile ownership as late as 2003. This table contrasts nicely with that for automobile ownership in 1939.
Once, when I was telling a student about automobile ownership, as an indication of wealth, in 1939, she responded that perhaps the British didn't need cars that much and so didn't buy them. Since Britain is geographically much more compact than the United States, and with a more extensive public transportation infrastructure, this may have been a reasonable observation. For 2003, however, things look rather different. While Canada (or even New Zealand) may have a lot of cars because of their size or lack of transportation infrastructure, this is hardly the case with Luxembourg, Italy, Germany, France, or Belgium. Nor do these countries necessarily have better incomes per capita: Only Luxembourg does better than the United States per capita in purchasing power parity. So they must just like their cars. It is hard to believe, indeed, that anyone loves cars more than Americans. But there it is. The statistics to 1998 are sufficient for the lessons that need to be learned. The most significant subequent development has been the continuing decline in unemployment, which reached 3.9% in April 2000.
Chart of Federal Budget Surpluses & Deficits, 1946-1998
Editorial Note, 2001
A new statistical illustration begins with the table at left. As new products are introduced into the economy, it takes a while for prices to come down and for the products to succeed in a mass market. The table at left shows various consumer products with the dates they were introduced and the dates at which they reached 25% of the population in the United States. I was told (at a lecture) that these numbers were from a book called The Innovator's Dilemma [Clayton M. Christensen, HarperBusiness, 2000]. I have not been able to find them in that book, but they look reasonable from what I have seen otherwise. What is striking about the table is that the rate of market penetration has increased over time.
US, inception to
25% ownershipelectricity 1873-1919 46y telephone 1876-1911 35y automobile 1886-1941 55y radio 1906-1928 22y television 1926-1952 26y personal
computers1975-1991 16y cellular
telephones1983-1996 13y the Internet 1994-1998 4y
gives comparative automobile ownership statistics for 1939 to show Italy's relative economic weakness. The United States is well out in front, at 22.7%, more or less where we might expect if it hits 25% in 1941. But the United States is way, way ahead of the next most prosperous economy, Britain, where we only have 5.4% ownership. This is especially striking when we consider that the United States entered 1939 with 20% unemployment -- a Depression level that was more persistent than it was in Britain. It simply shows the continuing potential strength of the US economy, even as the Hoover/New Deal policies were pricing a large part of the workforce out of jobs. Germany, where the mythology is that Hitler brought the country out of the Depression, can do no better than 2.5% auto ownership. Italy is far behind that (1.1%), and the Soviet Union miserable indeed (<0.5%). Since Germany, Italy, and the Soviet Union were all widely admired for their economic success in the 1930s, one might reasonably wonder what the fuss was about. The Soviet Union later became notorious for its lack of consumer goods, but if all of its capital spending on "heavy industry" didn't in the end produce or facilitate consumer goods, just what was it accomplishing? In fact, apart from the military, very nearly nothing. [In The Economist of July 26th-August 1st 2003, we find mention (p.11) that in contemporary Russia there are still only 153 motor vehicles per 1000 of population -- with only 39 in Kirgizstan -- both sobering statistics when we realize that Depression Era America was relatively wealthier in consumer goods than Russia is even more than a decade after the fall of Communism.]Automobile ownership per 1000 in 1939 US UK France Germany Italy USSR 227 54 51 25 11 <5
Editorial Note, 2007
Most people would probably expect the United States to have the highest automobile ownership in the world, just like in 1939. It is surprising that it is only 12th, behind places like Germany and France, where we would expect people to take public transportation. Well, perhaps they do, but they also own cars. Britain is still behind the US, but not by much. Meanwhile, Russia only has 142 cars per 1000 -- less than The Economist reported in 2003 itself. Japan, where there certainly is a great deal of public transportation, and its use, we still get ownership of 432 per 1000, ahead of Norway (430), Ireland (382), and the Netherlands (376). American ownership in 1939 (227) is comparable to Malaysia in 2003 (225).
Automobile ownership per 1000 in 2003 New
ZealandLuxem-
bourgCanada
Iceland
Italy
Germany
Switzer-
landMalta 619
574
564
557
547
546
521
518 Austria
France
Belgium
US
Sweden
Spain
Slovenia
UK 500
492
473
468
458
455
445
439
A, population of the 13 Colonies or of the United States
B, % of population that is rural
C, % of population that is urban (cities more than 2500 persons)
D, % of population in work force
E, % of work force in farm labor
F, % of work force that is female
G, % of work force unemployed
H, % of population below poverty level
I, % of non-white population below poverty level
J, % of families on AFDC (Aid to Families with Dependent Children)
K, first time enrollments in DOL (Department of Labor) work and training
   programs

      A
1610  350
1620  2,300
1630  4,600
1640  26,600
1650  50,400
1660  75,100
1670  111,900
1680  151,500
1690  210,400
1700  250,900
1710  331,700
1720  466,200
1730  629,400
1740  905,600
1750  1,170,800
1760  1,593,600
1770  2,148,100
1780  2,780,400
1790  3,929,214

      A             B      C      D      E
1800  5,308,483     93.9   6.1
1820  9,638,453     92.8   7.2
1830  12,866,020
1840  17,069,453    89.2   10.8   46.6   68.6
1850  23,191,876                  46.8   63.7
1860  31,443,321    80.2   19.8   47.0   58.9
1870  39,818,449                  45.8   53.0
1880  50,155,783    71.8   28.2   47.3   49.4      1880: E drops below 50%
1890  62,947,714                  49.2   42.6

      A             B      C      D      E      F      G      H
1894                                                   18.4
1900  75,994,575    60.3   39.7   50.2   37.5   18.3   5.0    40
1901                                                   4.0
1902                        1900: D above 50%          3.7
1903                                                   3.9
1904                                                   5.4
1905                                                   4.3
1906                                                   1.7
1907                                                   2.8
1908                                                   8.0
1909                                                   5.1
1910  91,972,266                  52.2   31.0   19.9   5.9
1911                                                   6.7
1912                                                   4.6
1913                                                   4.3
1914                                                   7.9
1915                                                   8.5
1916                                                   5.1
1917                                                   4.6
1918                                                   1.4
1919                                                   1.4

      A             B      C      D      E      F      G      H
1920  105,710,620   48.8   51.2   51.3   27.0   20.4   5.2
1921                                                   11.7
1922                 1920: C above 50%                 6.7
1923                                                   2.4
1924                                                   5.0
1925                                                   3.2
1926                                                   1.8
1927                                                   3.3
1928                                                   4.2
1929                                                   3.2
1930  122,775,046                 49.5   21.4   22.0   8.0
1931                                                   15.9
1932                                                   23.6
1933                                                   24.9
1934                                                   21.7
1935                                                   20
1936                                                   16.9
1937                                                   14.3   40/45?
1938                                                   19.0
1939                                                   17.2

      A             B      C      D      E      F      G
1940  131,669,275   43.5   56.5   52.2   17.4   24.3   14.6
1941                                                   9.9
1942                                                   4.7
1943                                                   1.9
1944                                                   1.2
1945                                                   1.9
1946                                                   3.9
1947                                                   3.9
1948                                                   3.8
1949                                                   6.1

      A             D      E      F      G      H      I      J      K
1950  150,697,361   53.5   11.6   29.6   5.3    30.2          1.66
1951  151,599,000                        3.3    28.0          1.48
1952  153,892,000                        3.0    27.9          1.47
1953  156,595,000                        2.9    26.2          1.34
1954  159,695,000                        5.5    27.9          1.47
1955  162,967,000                        4.4    24.5          1.44
1956  166,055,000                        4.1    22.9          1.43
1957  169,110,000                        4.3    22.8          1.53
1958  172,226,000                        6.8    23.1          1.73
1959  175,277,000                        5.5    22.4   58.2   1.75
1960  179,323,175   55.3   6.0    33.4   5.5    22.2   56.4   1.78
1961  182,992,000                        6.7    21.9   56.8   2.01
1962  185,771,000                        5.5    21.0   56.1   2.01   0
1963  188,483,000                        5.7    19.5   51.1   2.03   34.1k
1964  191,141,000                        5.2    19.0   49.8   2.13   77.6k
1965  193,526,000                        4.5    17.3   47.1   2.20   157k
1966  195,576,000                        3.8    15.7   40.8   2.32   236k
                                                /14.7  /39.7
1967  197,457,000                        3.8    14.2   38.2   2.64   833k
1968  199,399,000                        3.6    12.8   32.8   3.04   781k
1969  201,385,000                        3.5    12.1   30.9   3.69   1M
1970  203,302,031   58.2   3.1    38.1   4.9    12.6   31.6   4.95   1.1M
1971  206,212,000                        5.9    12.5   31.3   5.62   1.4M
1972  208,230,000                        5.6    11.9   32.4   5.86   2.0M
1973  209,851,000                        4.9    11.1   29.3   5.80   1.5M
1974  211,390,000                        5.6    11.6   30.5   6.04   1.9M
                                                /11.2  /29.7
1975  213,137,000                        8.5    12.3   29.8   6.40   2.8M
1976  214,680,000                        7.7    11.8   29.5   6.37   3.2M
1977  216,400,000                        7.1    11.6   29.0   6.25   3.4M
1978  218,228,000                        6.1    11.4   29.4   6.10   3.9M
1979  220,099,000                        5.8    11.6   28.9   6.16   4.0M
                                                /11.7  /28.1
1980  226,545,805   62.0   2.2    42.5   7.1    13.0   29.9   6.57   3.7M
                                                /12.9

      A             D      E      F      G      H
1981                                     7.6    14.0
1982                                     9.7    15.0
1983                                     9.6    15.2
1984                                     7.5    14.4
1985                                     7.2    14.0
1986                                     7.0    13.6
1987                                     6.2    13.4
1988                                     5.4    13.0
1989                                     5.3    12.8
1990  248,709,873   65.3   1.6    45.3   5.5    13.5
1991                                     6.9    14.2
1992                              45.5   7.4    14.8/14.5
1993                              45.6   6.8    15.1
1994                                     6.1    14.5
1995                                     5.6    13.8
1997 May                                 4.8
1997 June                                5.0
1997 September                           5.3    13.7
1997 October                             4.7
1997 November                            4.6
1998 March                               4.7
1998 April                               4.3
1998 August                                     13.3
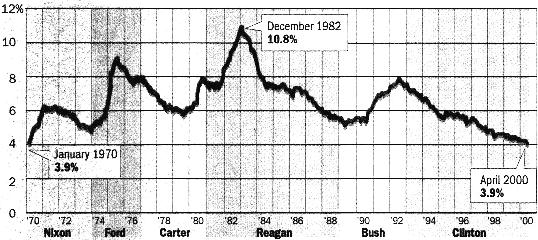
The chart, from the May 6, 2000 Los Angeles Times, displays the course of unemployment in the United States since the last time it was 3.9%, thirty years ago, in 1970. It is encouraging that as much progress has been made, despite the new costs continually imposed on business and the hostile atmosphere that continues in the press and in trendy politics. One wonders how robust or delicate it may prove to be.
Copyright (c) 1996, 1997, 1998, 2000, 2001, 2002, 2003 Kelley L. Ross, Ph.D. All Rights Reserved